Mastering Network Debugging: A Guide with Tshark

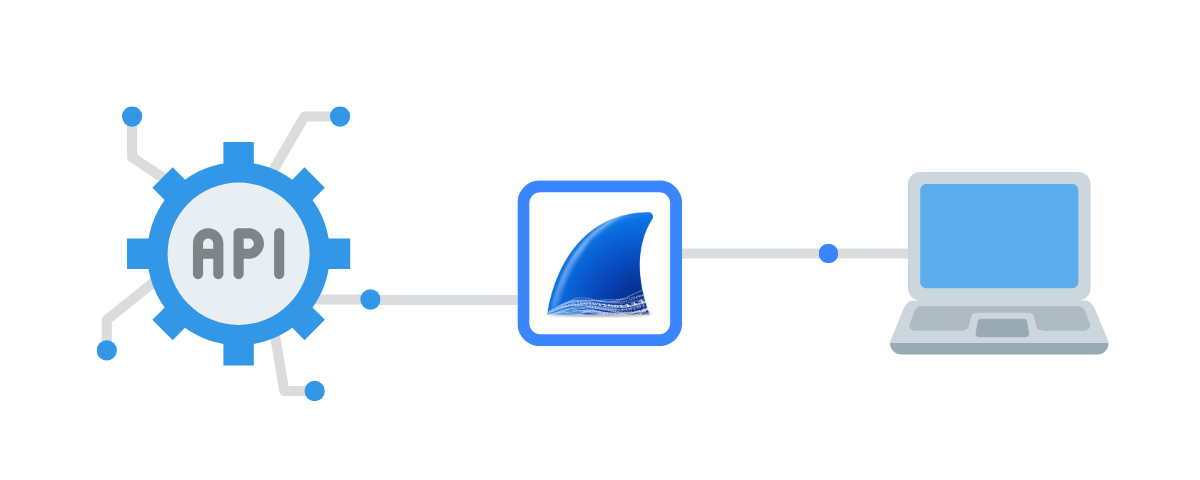
Numerous tools are available for network debugging, from debugging a REST API to analyzing traffic on a router or local network.
A comparison can be found on our Wireshark article.
Tshark is the CLI version of wireshark, and lets you capture with your favorite tool when you don't have access to a GUI, or when the CLI server simply doesn't have a graphical environment.
The advantage is that you can export the network capture and open it on your PC with Wireshark! We'll look at this at the end of the article.
How to use Tshark
Installing tshark
You can follow the official documentation, on debian-based just tap apt install tshark.
You can also get tshark by installing Wireshark. And like wireshark, tshark uses Dumpcap as its capture engine.
Tshark has the advantage of being a lightweight, powerful tool that can be installed on many platforms.
On installation, you can choose whether to give access to network analysis to all users or only to sudoers.
How do I capture packages with Tshark?
Useful basic commands
To see the list of capturable interfaces: tshark -D. You also have the advantage of seeing virtual interfaces.
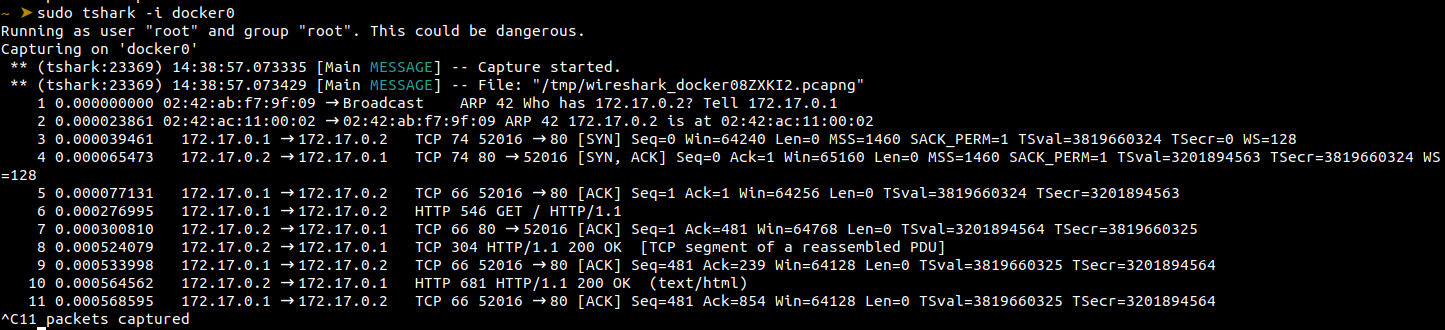
To capture: tshark or tshark -i <interface_name>.
You can make complex filters with tshark -f "${filter} like tcp port 80, in the same way as filters on wireshark.
Further information
The official documentation is very comprehensive, and the tshark --help command is very useful, as is the man.
Export and open capture on Wireshark
A huge advantage of tshark is its intercompatibility and capture format.
To save a capture in a file, use the -w option like this: tshark -w <filename>.pcap.
To read a pcap file, you have two options:
- open in GUI with Wireshark
- open with tshark by coloring with:
tshark -r <filename>.pcap --color.