Mastering REST API Debugging: A Guide with Wireshark

When working with an API, it is important to be able to debug it.
API debugging tools can be divided into two classes: those that allow editing of the sent HTTP requests and those that inspect the network to see what has been sent retrospectively.
In the first category, there are well-known tools such as Postman, Insomnia or Curl.
| Postman | Insomnia | Curl | |
|---|---|---|---|
| GUI | ✅ | ✅ | ❌ |
| Open source | ❌ | ✅ | ✅ |
| Export requests as code | ✅ | ✅ | ❌ |
| Import OpenAPI format | ✅ | ❌ | ❌ |
| User friendly | ⭐️⭐️⭐️⭐️ | ⭐️⭐️⭐️ | ⭐️ |
| Installation process difficulty | ⭐️⭐️ | ⭐️⭐️ | ⭐️⭐️⭐️⭐️ |
In the second category, Wireshark overcomes most available solutions. Fortunately, it is open-source and free of charge.
When should we use Wireshark ?
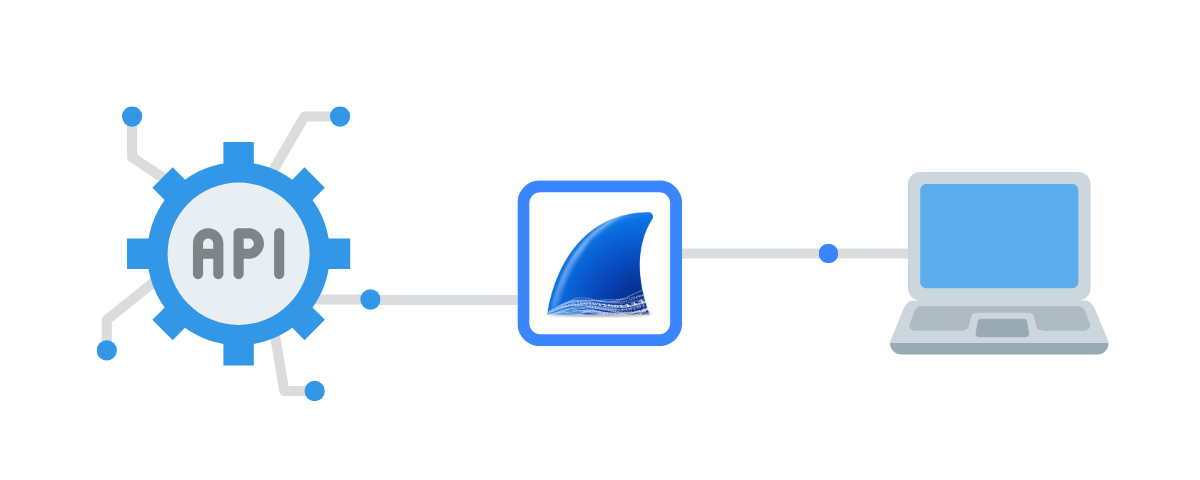
Wireshark allows us to intercept network requests, making it useful when:
- We want to know the network requests of a tool without having access to its code.
- We want to verify the content of requests sent by a service.
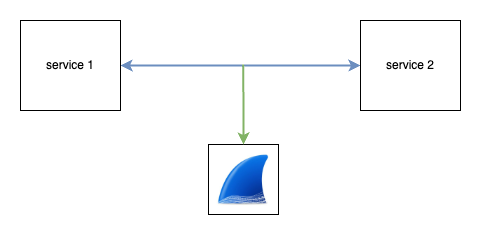
Below, it is emphasized that Wireshark is non-intrusive in the sending or receiving of HTTP requests; it acts as an observer of the network.
How to use Wireshark ?
To install Wireshark, you can follow the official installation page.
Once installed and opened, Wireshark displays the available networks on the computer along with their activity (see screenshot below).
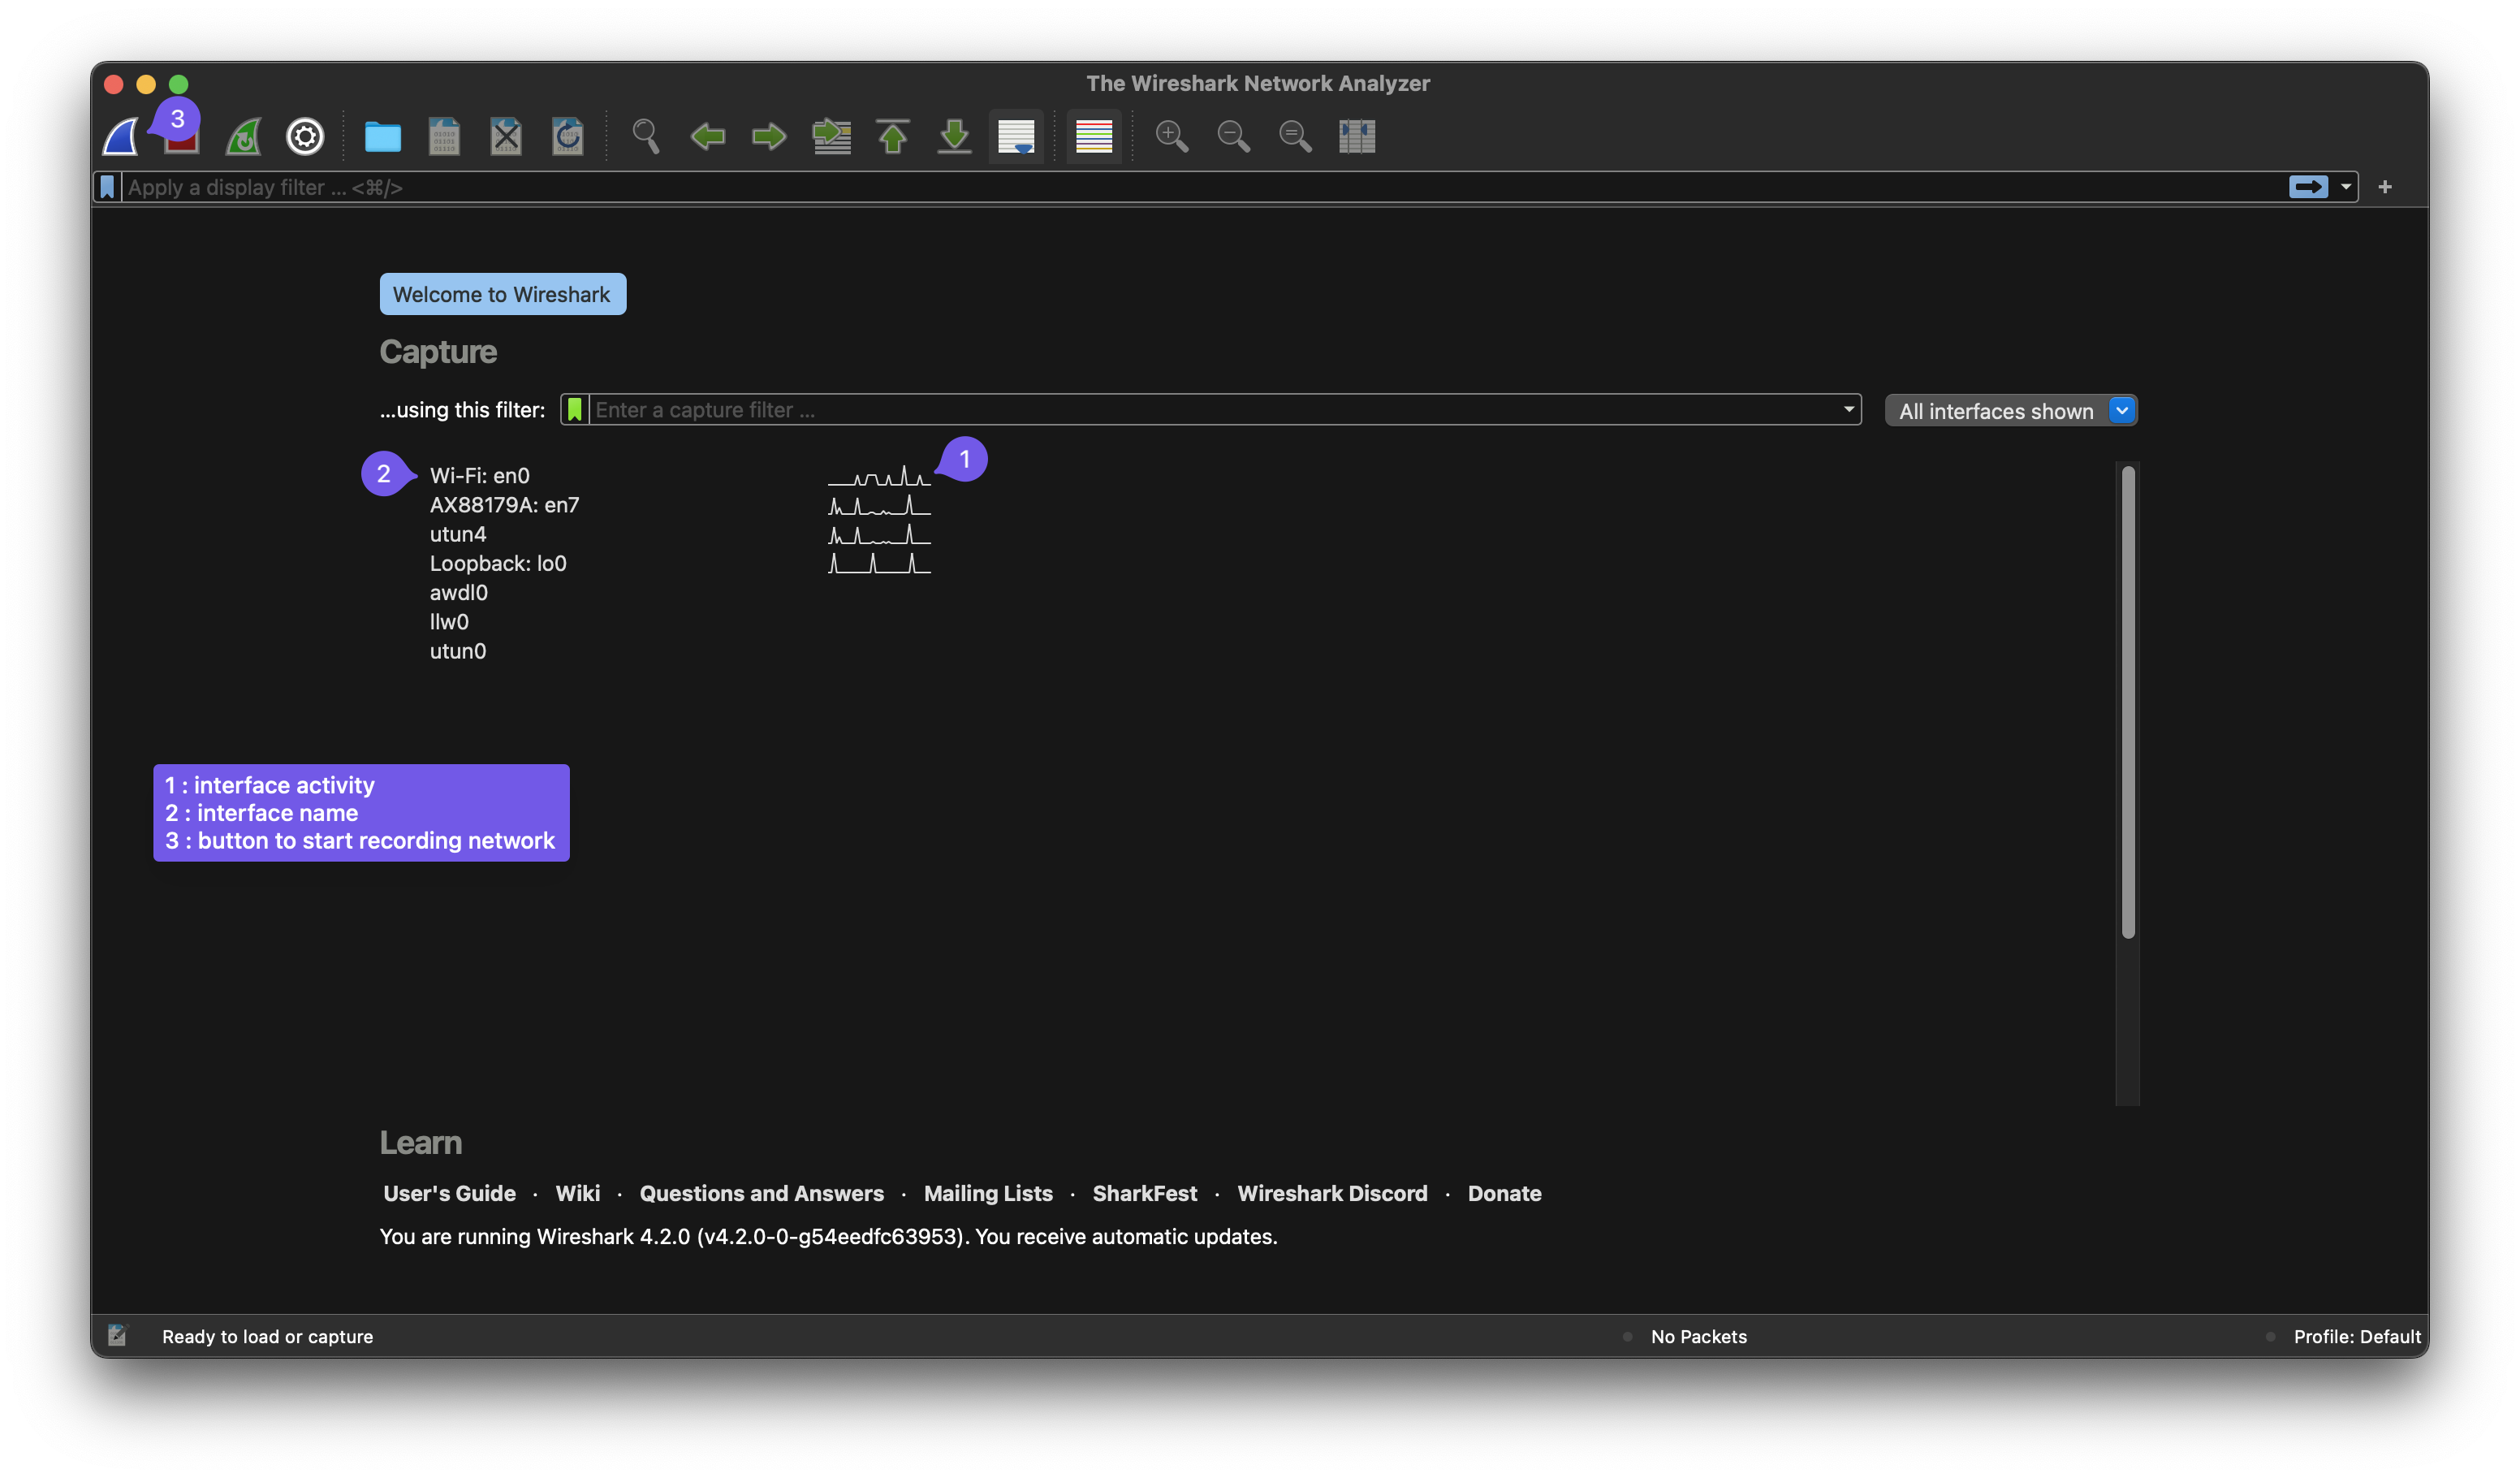
After selecting an interface, the user can start capturing requests. It's important to note that HTTPS requests will be captured but appear encrypted and unreadable.
As shown in the screenshot below, the user can also add filters to display only relevant requests.
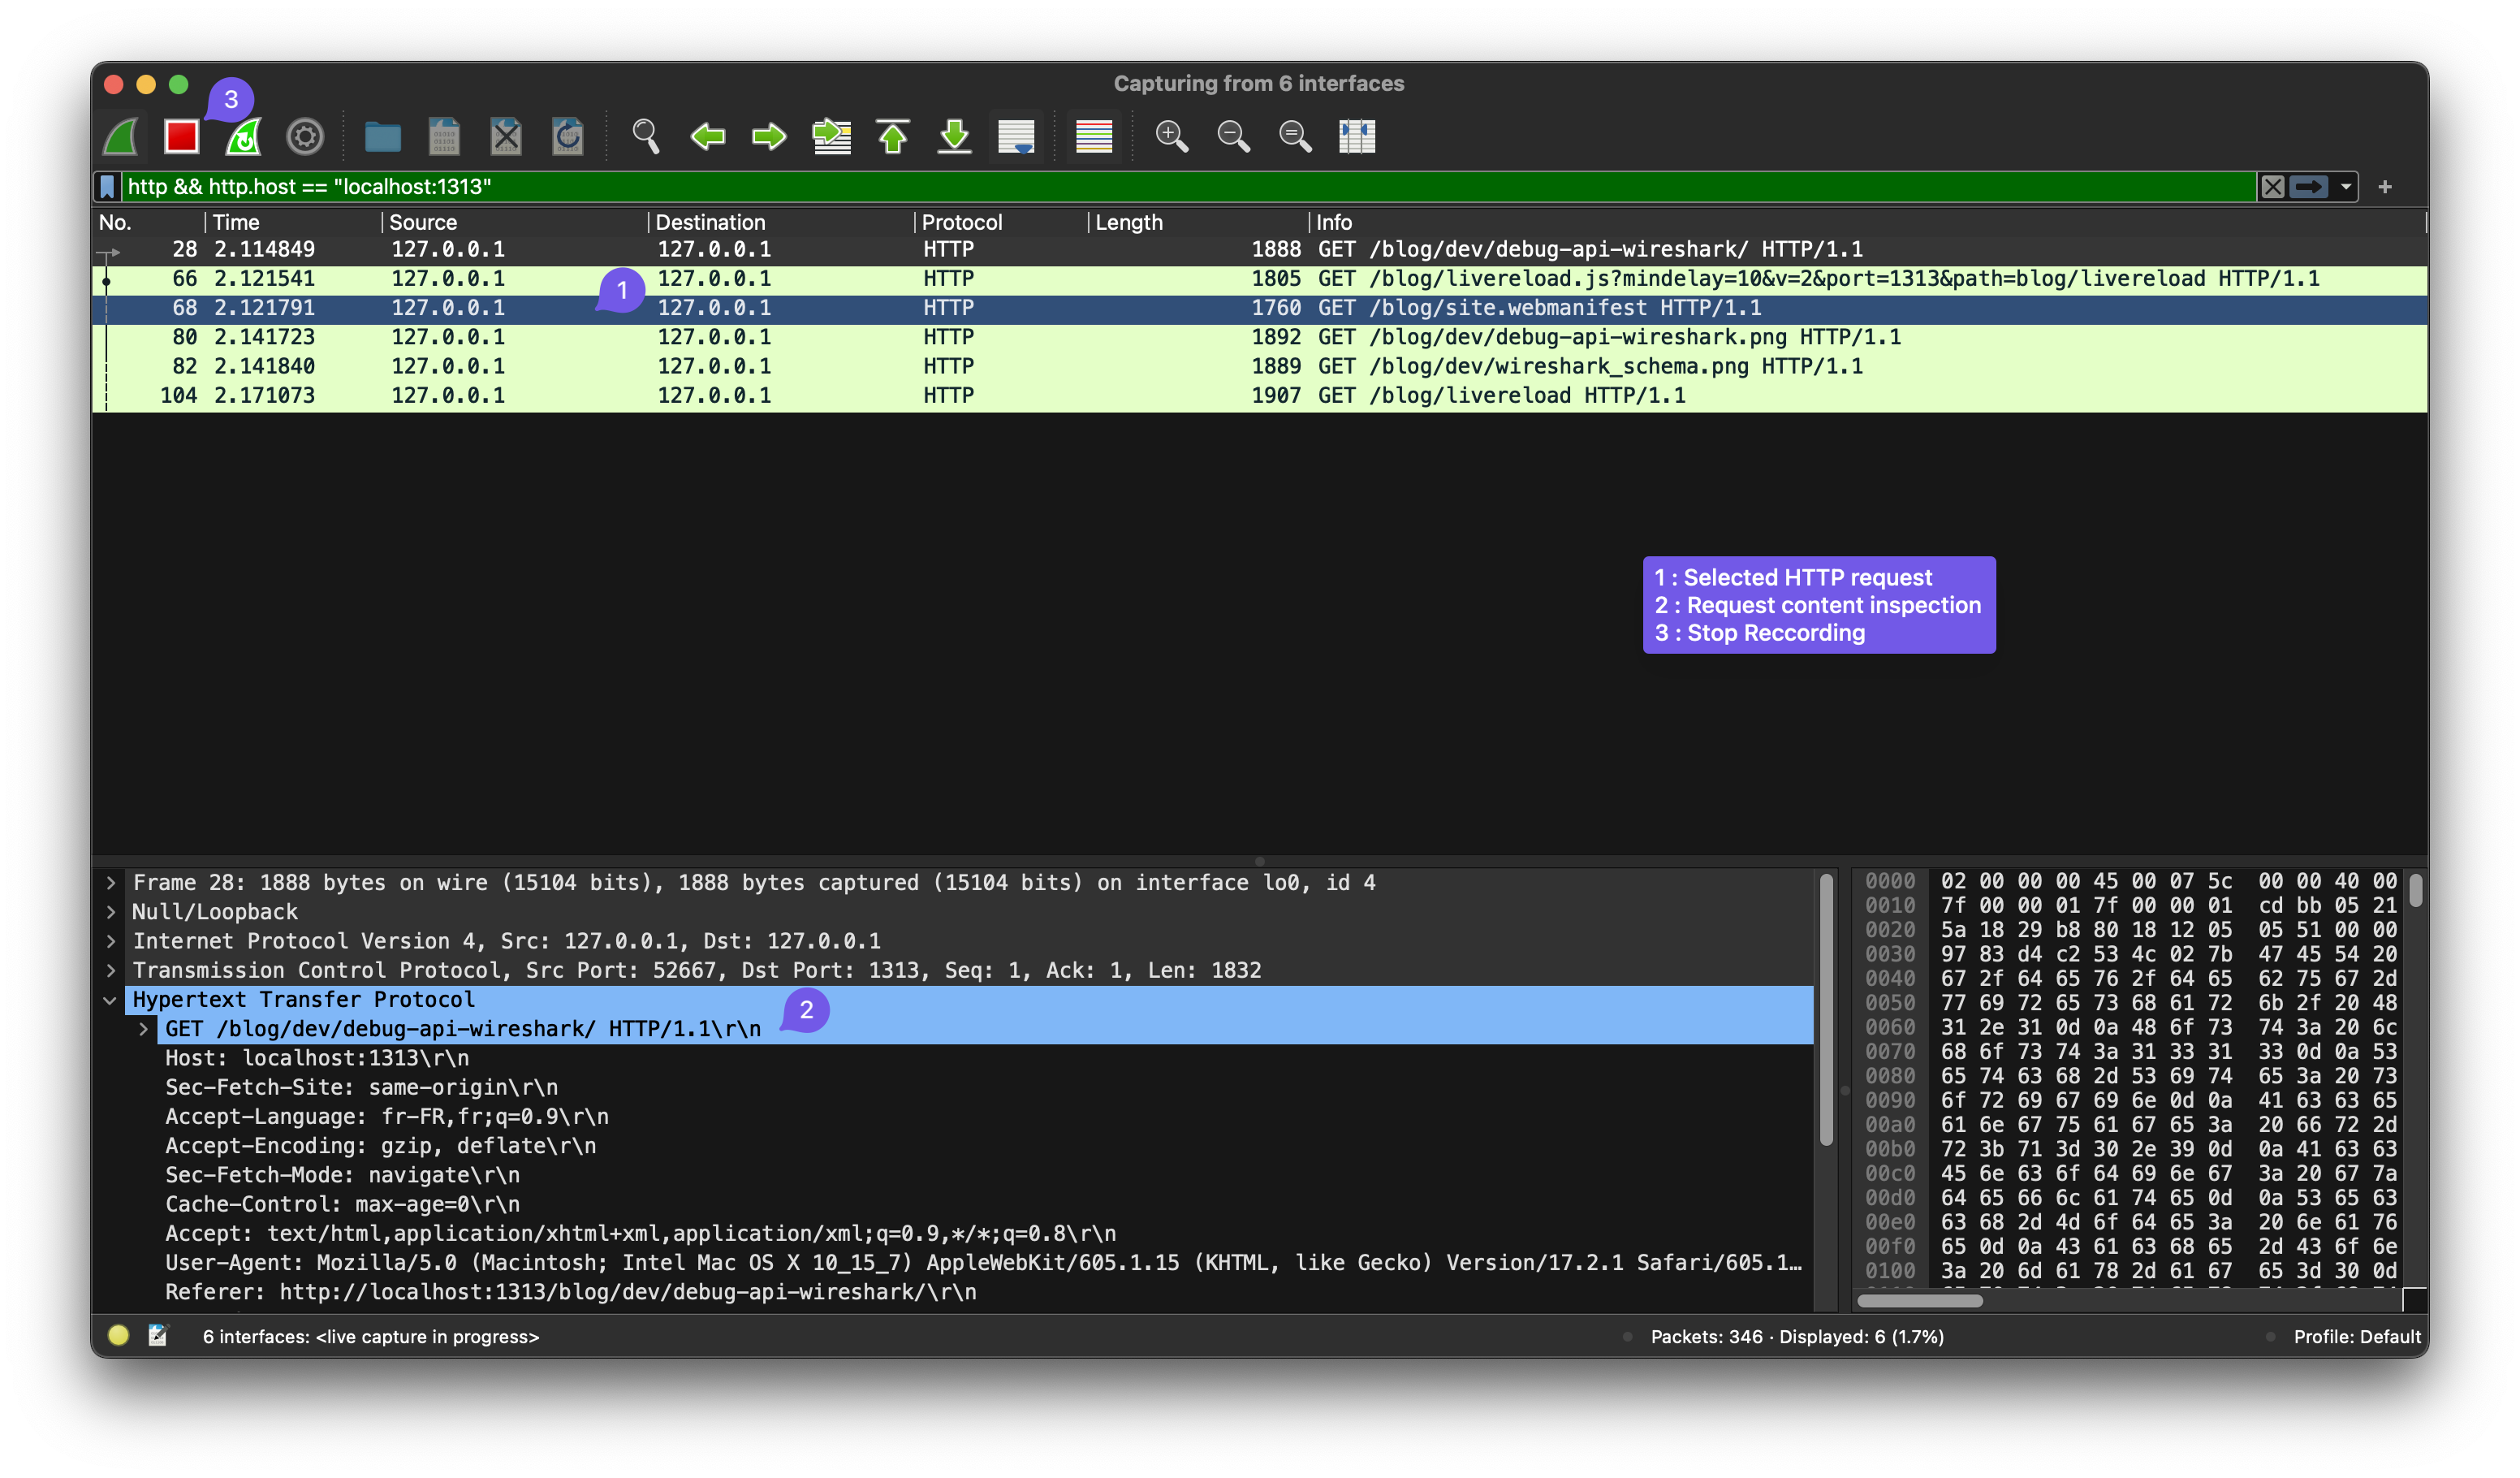
The request inspection interface is particularly useful. It allows a detailed look at the content of the HTTP request, helping to understand what the recipient has received.
Wireshark's "non-intrusive" capability makes it a valuable ally in debugging applications.